What is Lamaxu?
LAMAXU (pronounced Lamasu) simplifies the complexity of IBM MQ (MQSeries) monitoring by consolidating and delivering all critical monitoring data through a single, easy-to-use collector.
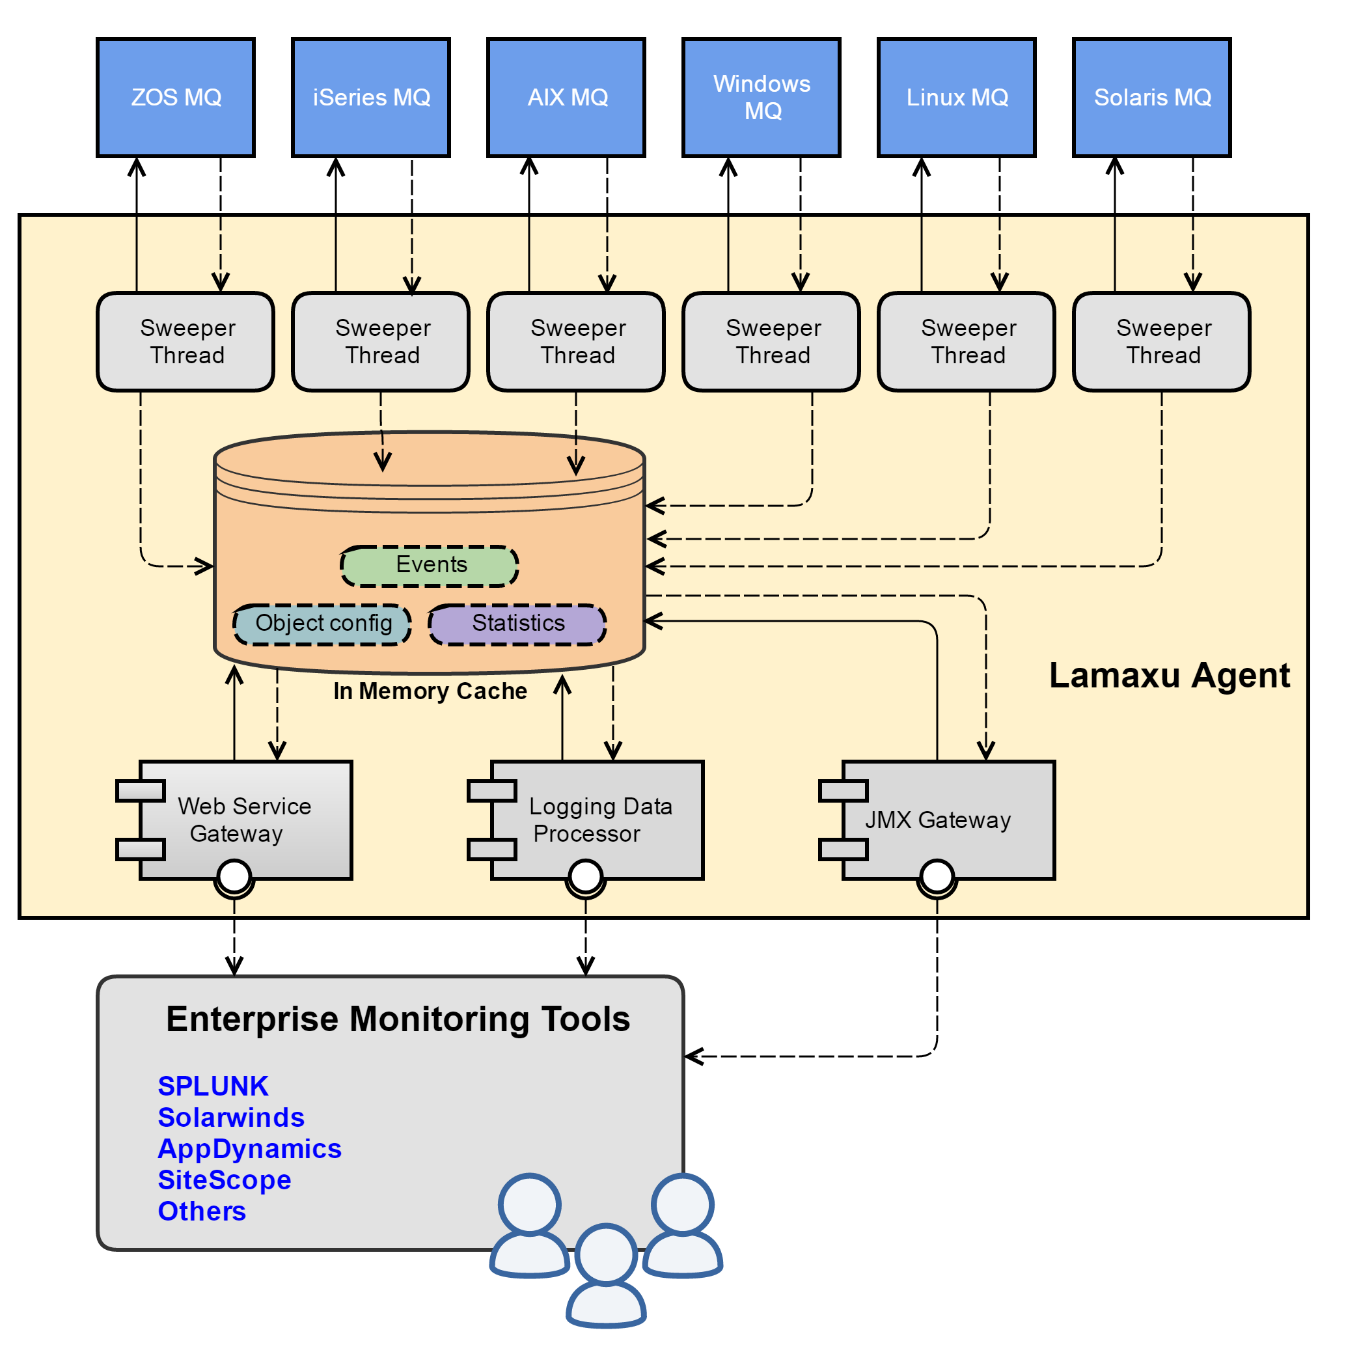
LAMAXU has been purpose built to fit the gap between IBM MQ and most leading enterprise monitoring platforms. MQ metrics are exposed in different ways to maximize the reuse of your enterprise services and save you money.
The JMX gateway enables the monitoring of IBM MQ resources using standard Java JMX technology by instrumenting MQ’s metrics and statistics as Java MBeans, making a queue manager appear as just another Java application server.
The logging engine provides powerful data processing capabilities, translating MQ metrics into log files formatted as either XML or JSON. As SPLUNK natively understands these formats it’s extremely easy to get SPLUNK working to produce reports and alerts.
Both Solarwinds and AppDynamics interface natively with Java JMX MBeans, making MQ appear like a Java App Server.
COMPATIBLE WITH
- IBM MQ versions 8.0.x - 9.x
- IBM MQ Appliance
- IBM MQ for z/OS
- IBM MQ for iSeries
- IBM MQ for UNIX
- IBM MQ for Windows
While many enterprise-grade monitoring solutions offer IBM MQ monitoring, they often provide only basic functionality—typically limited to tracking metrics like queue depths.
With LAMAXU, you can significantly reduce both effort and costs by extending your existing monitoring solution, like Solarwinds, SPLUNK and AppDynamics to cover a comprehensive range of IBM MQ metrics. All MQ data is made available through standard formats, including:
- JMX MBeans
- HTTP REST (XML and JSON formats)
- Log files (XML or JSON formatted logs for SPLUNK consumption)

Exposed Metrics
Lamaxu streamlines the process of extracting valuable IBM MQ metrics from complex, distributed systems. Nearly all of IBM MQ’s internal data, such as events, statistics, statuses, configurations, and more, are made accessible. Lamaxu allows for the centralized collection of every MQ metric that is relevant to your business, ensuring you have the insights you need to make informed decisions.
Secure Connectivity
Lamaxu leverages transports that offer SSL/TLS encryption and authentication and can integrate with LDAPS (OpenLDAP or Active Directory) to manage user and group access.
Flexible Logging
The logging engine provides powerful data processing capabilities, translating MQ metrics into log files formatted as either XML or JSON. As SPLUNK natively understands these formats it’s extremely easy to get SPLUNK working to produce reports and alerts.
Statistics
Lamaxu simplifies the extraction of crucial IBM MQ metrics from complex, distributed systems. By leveraging Lamaxu you gain access to nearly all of IBM MQ’s internal data. Lamaxu enables the centralized collection of all MQ metrics that matter to your business, providing the insights needed to drive informed decisions.
JMX Gateway
The JMX gateway enables the monitoring of IBM MQ resources using standard Java JMX technology by instrumenting MQ’s metrics and statistics as Java MBeans, making a queue manager appear as just another Java application server.
Agentless
Lamaxu is an ‘Agentless’ agent. It is designed to run from a central location and collect metrics from remotely connected MQ systems.
REST API
Lamaxu’s API offers seamless access to a wide range of MQ data, including events, statistics, status information, configurations, and unique aggregated performance metrics like message rates and queue backlog times. The REST API delivers responses in a key/value format, available in both JSON and XML. This flexibility allows you to integrate the data into various applications, such as building custom web dashboards tailored to your needs..
Simplicity
Lamaxu is completely stand-alone and does not require a database or a central management server to operate. This allows Lamaxu to be deployed very quickly, saving you valuable time and costs.
